The 3 AM Debugging Partner: Using Interactive Workflows for Complex Problem-Solving
Transform frustrating debugging sessions into structured problem-solving with an AI thinking partner. This workflow implements the scientific method for bug investigation, guiding you through systemat
Target Audience: Solo Developers, Indie Hackers
When the Rubber Duck is Not Enough
It is 3 AM. You have been staring at the same stack trace for two hours. The bug only manifests in production. Your tests pass. Your local environment works perfectly. And the only colleague available to bounce ideas off is a rubber duck sitting on your monitor.
Every solo developer knows this moment of isolation. You need a thinking partner, someone to methodically work through hypotheses, challenge your assumptions, and help you see the problem from angles you have missed. Traditional rubber duck debugging works for simple bugs, but complex problems require interactive dialogue.
limerIQ transforms your debugging sessions from lonely frustration into structured problem-solving conversations. The interactive workflow pattern turns AI into a systematic debugging partner that never gets tired, never loses patience, and has infinite capacity for technical problem-solving.
The Debugging Partner Pattern
Effective debugging is not about writing more code or adding more logging. It is about systematic hypothesis testing. The scientific method applied to software: observe the symptoms, form hypotheses, design experiments, test them, and iterate.
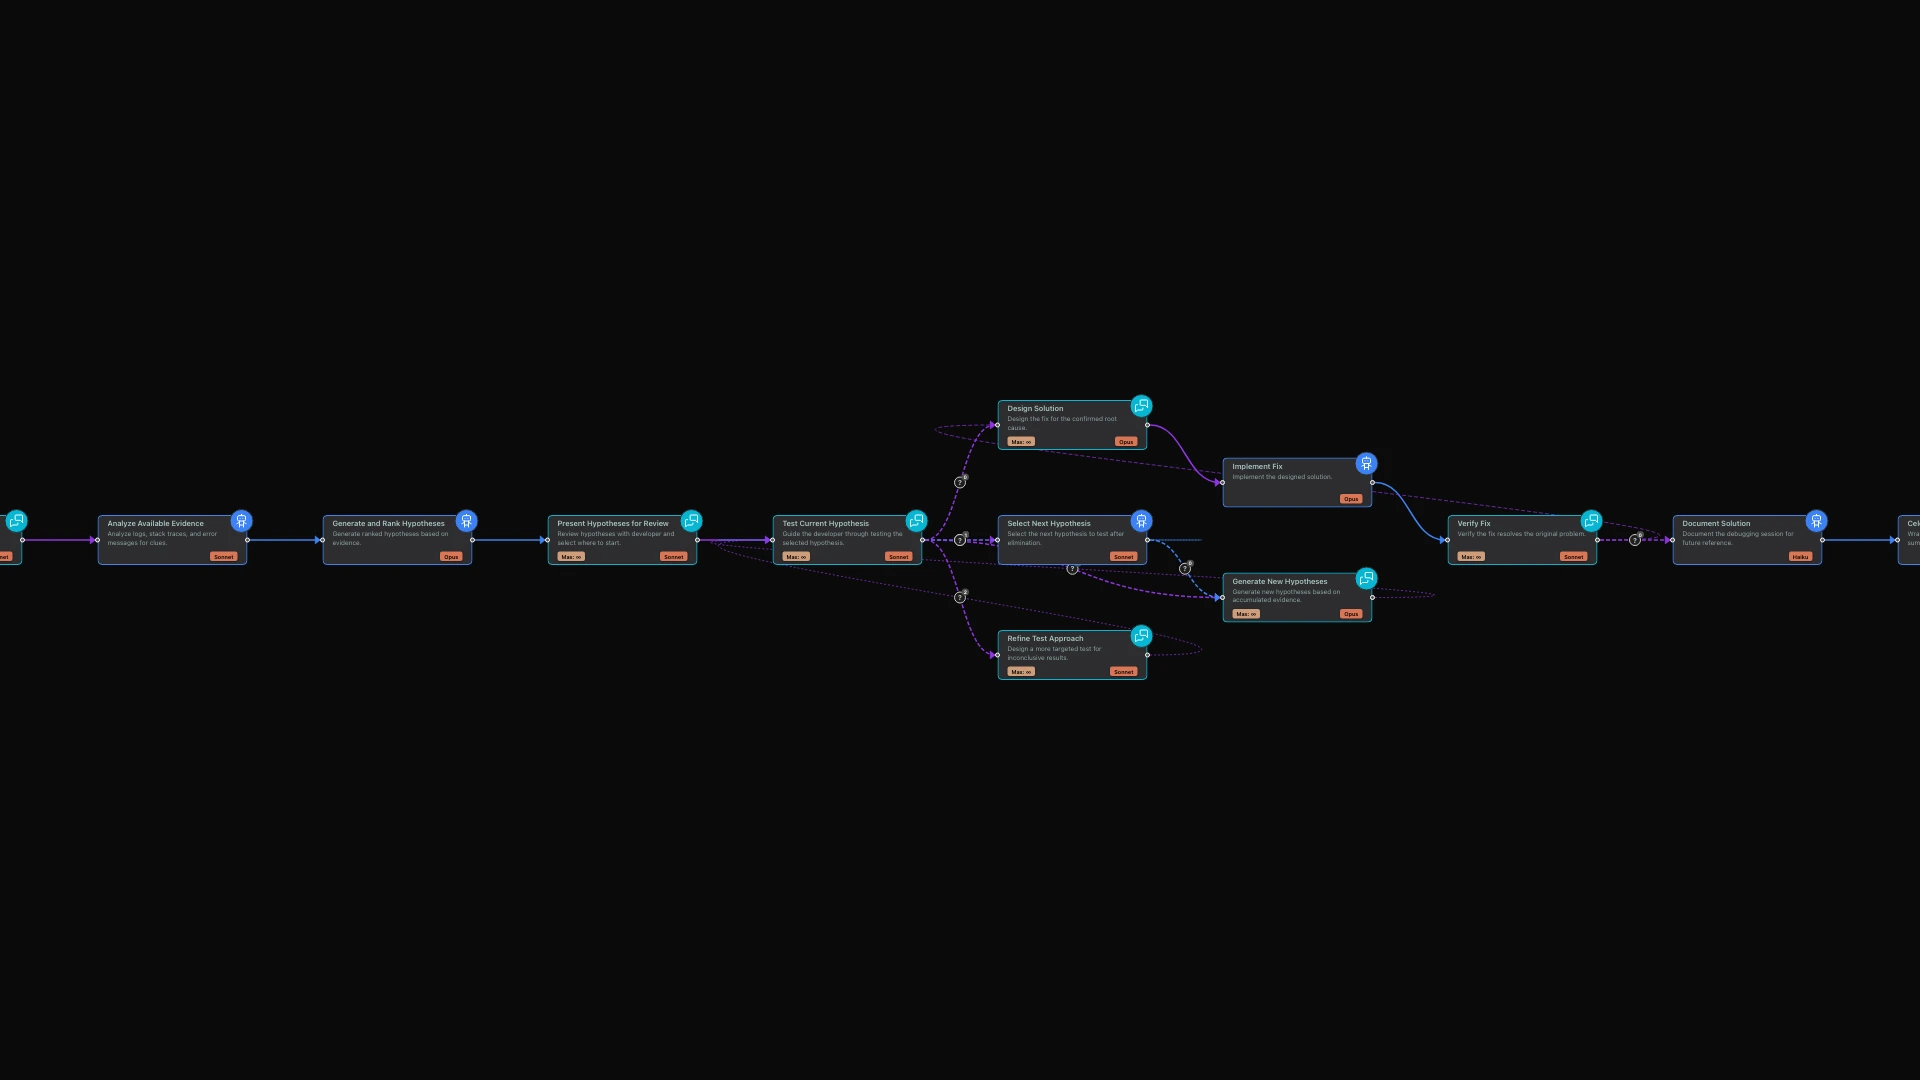
The limerIQ visual workflow editor lets you design debugging workflows that guide this methodology. Here is how the process unfolds.
Phase 1: Problem Definition
Before diving into code, you need to articulate the problem clearly. The workflow begins with an interactive conversation that extracts critical information.
The AI asks probing questions: What behavior did you expect? What behavior are you actually seeing? When does it happen, always or only under specific conditions? What changed recently, any deployments, dependencies, or configuration? What have you already tried?
This is not just information gathering. The act of explaining a problem to someone else often reveals the answer. The workflow exploits this by asking questions that force you to examine assumptions you did not know you were making.
Phase 2: Hypothesis Generation and Ranking
With a clear problem definition, the workflow shifts to systematic hypothesis generation. Based on what you described, the AI generates a ranked list of possible causes.
For each hypothesis, the AI states the theory clearly, explains why this could cause the observed behavior, suggests a quick test to validate or eliminate it, and estimates the probability of being correct.
The key insight here is probability ranking. Most debugging time is wasted testing unlikely hypotheses while the obvious culprit hides in plain sight. The workflow forces explicit probability estimates, front-loading investigation of high-probability causes.
Phase 3: Iterative Testing Loop
The real power of the debugging partner emerges in the iterative testing loop. Each hypothesis gets tested systematically.
The AI guides you through testing the current hypothesis. First, it confirms you understand the test. Then it waits while you execute it. Then you analyze results together. Finally, you decide: is this hypothesis confirmed, eliminated, or do you need more data?
If a hypothesis is eliminated, the AI explains why and moves to the next one. If confirmed, you celebrate and move to solution design. If the results are unclear, you design a more targeted test together.
This is where interactive workflows shine. Unlike static automation, the workflow adapts to your responses. If a test reveals unexpected information, the debugging partner can pivot, generate new hypotheses, or dig deeper into a promising lead.
A Real Debugging Session
Let me walk through how this plays out with a real problem: an API that returns 500 errors intermittently in production but never fails locally.
The Conversation Begins
You describe the problem: your API keeps returning 500 errors in production, but it works fine locally.
The AI starts probing: What is the error rate? Is it constant or varying? Which endpoints are affected, all of them or specific ones? When did this start? Can you correlate with any deployment or change? What do your logs show for the failed requests?
Clarifying the Problem
You provide more detail: about 5% of requests fail, only the /api/process endpoint is affected, it started three days ago, and logs show timeout on database connection.
The AI begins forming hypotheses: Database connection timeouts on a specific endpoint suggest a few possibilities. That endpoint's query might be slow due to locks, missing indexes, or data growth. Connection pool exhaustion under load could be the culprit. There might be network issues between your app server and database. Or perhaps a recent schema or query change on that endpoint is causing problems.
The AI asks a targeted follow-up: When did you last modify the /api/process code or its database queries?
Hypothesis Ranking
After gathering details, the workflow produces ranked hypotheses:
First hypothesis, rated high probability: Connection pool exhaustion. You increased traffic threefold last week. The 5% failure rate suggests pool capacity issues. The test is to check connection pool metrics and temporarily increase pool size.
Second hypothesis, rated medium probability: Slow query added recently. The endpoint changed five days ago. Timeouts started three days ago after data accumulated. The test is to run query analysis on the new query.
Third hypothesis, rated low probability: Database server resource limits. No infrastructure changes were reported. This would likely affect all endpoints. The test is to check database server CPU, memory, and connections.
Testing the Lead Hypothesis
The AI guides you to test hypothesis one first: Check your connection pool metrics. What is your current pool size and how many connections are in use during failures?
You check and report: Pool size is 10. During high traffic, you are hitting 10 out of 10.
The AI confirms the finding: That is the issue. Your pool is exhausted during load spikes. The 5% failure rate matches your traffic variance. Here are the options: increase pool size to 25-30, add connection queueing with timeout, or optimize the slow query to release connections faster.
The interactive nature meant you found the root cause in minutes, not hours. The structured hypothesis approach prevented wasted effort investigating unlikely causes.
Why Interactive Workflows Matter for Debugging
The debugging workflow leverages several powerful capabilities.
Multi-Turn Context: Each exchange builds on previous ones. The workflow remembers that you mentioned traffic increased and correlates it with the connection pool hypothesis without you needing to repeat yourself.
Adaptive Questioning: If you give a vague answer, the workflow probes deeper. If you provide detailed information, it moves faster. This adaptive behavior is impossible with static scripts or documentation.
Flow Control: The workflow respects your time. If you realize the issue mid-conversation, you can signal that you have solved it, and the workflow captures the solution for future reference. If you need to step away, you can pause and resume later with full context preserved.
Guided Methodology: Solo developers often debug chaotically, jumping between theories. The workflow imposes structure without rigidity. You can skip hypotheses, add new ones, or dive deep on a promising lead, but the methodology keeps you anchored.
Debugging Patterns the Workflow Supports
The workflow handles multiple debugging scenarios.
The "Works on My Machine" Problem: Systematic comparison of local versus production environments. The workflow guides you through checking configuration differences, environment variables, dependency versions, and data differences.
The Intermittent Failure: Race conditions, timing issues, and resource exhaustion. The workflow helps you identify reproducible conditions and design tests that expose the intermittent nature.
The Recent Regression: Bisecting your git history with hypothesis testing. The workflow helps you identify the most likely commit ranges and test them systematically.
The Third-Party Integration Failure: External service issues require different debugging approaches. The workflow guides you through isolation tests, API response analysis, and vendor communication.
Beyond Bug Fixing: A Thinking Partner
The debugging partner workflow demonstrates a broader pattern: using interactive workflows for any complex problem-solving that benefits from structured dialogue.
Architecture Decisions: Run the workflow to talk through design trade-offs. The methodology of hypothesis generation and testing applies equally to "should we use microservices or monolith?" as to "why is this API slow?"
Code Review: Use interactive workflows to walk through your own code changes. The AI asks questions a reviewer would ask, catching issues before they reach production.
Learning New Codebases: The questioning methodology helps you build mental models of unfamiliar code. Instead of reading documentation passively, engage in active dialogue about how systems work.
The Value of Not Being Alone
Solo development is not lonely because you lack colleagues. It is lonely because you lack sounding boards, devil's advocates, and thinking partners. The debugging partner workflow fills this gap not by replacing human collaboration but by providing it when human collaborators are not available.
At 3 AM, when the bug is obscure and the stakes are high, having a systematic debugging partner changes everything. Not because it knows the answer, but because it helps you find it yourself through structured dialogue.
That is the difference between a rubber duck and a debugging partner. The duck listens. The partner thinks with you.
Getting Started
Open the limerIQ visual workflow editor and explore the debugging partner template. You will see how the workflow flows from problem definition through hypothesis generation to iterative testing.
The next time you hit a tricky bug, start a debugging session. Let the structured methodology guide your investigation. Watch how the interactive dialogue surfaces insights you would have missed debugging alone.
Save your debugging sessions for future reference. When you encounter similar problems, your past solutions become a knowledge base that accelerates future debugging.
Related Articles: