See Your Workflow Think: The Visual Editor and Subway Map
A comprehensive workflow demonstrating all limerIQ step types and visual editor capabilities, from project discovery through sprinted execution. Perfect for learning the platform's full potential and
Workflow orchestration systems often suffer from a fundamental visibility problem. Configurations sit in files, executions happen in terminals, and developers are left mentally simulating what their AI agents are doing. limerIQ changes this equation with two interconnected visual systems: a visual editor for workflow design and a real-time subway map for execution tracking.
The Problem with Invisible Workflows
Traditional AI orchestration tools operate like a black box. You write configuration, hit execute, and hope for the best. When something goes wrong, you dig through logs. When explaining your workflow to a colleague, you reach for a whiteboard because there is nothing visual to show them.
This invisibility creates real problems:
- Design friction: Developers must mentally visualize branching logic while working in text
- Debugging blindness: Failed steps require log archaeology to understand context
- Collaboration barriers: Workflows cannot be reviewed or discussed visually with stakeholders
- Onboarding delays: New team members cannot grasp workflow architecture at a glance
limerIQ addresses each of these with purpose-built visual tooling that treats workflows as first-class visual artifacts.
The Visual Editor: Seeing Your Workflow's Structure
The workflow visual editor renders your workflow as an interactive node graph. Open any workflow file in your editor, and the visual representation activates automatically. What was abstract becomes concrete. What required imagination becomes visible.
Understanding Step Types at a Glance
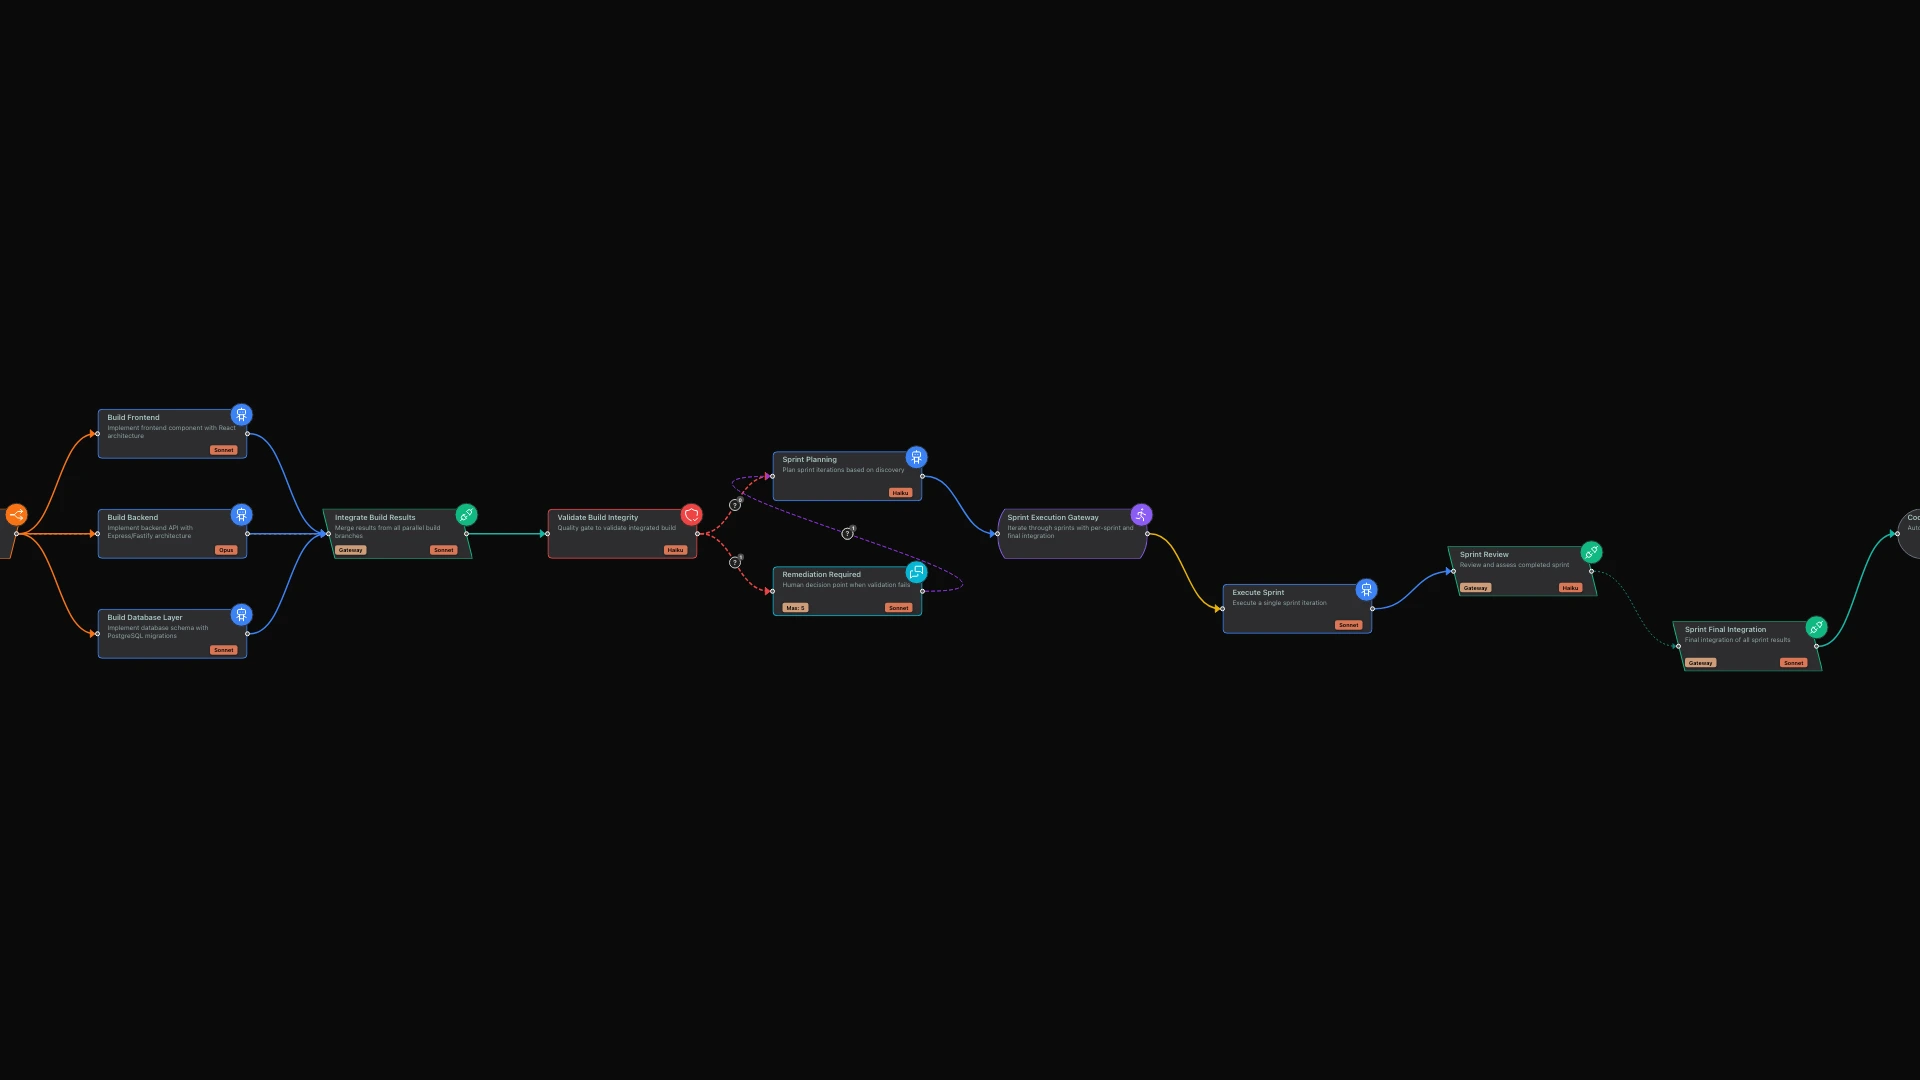
Each type of step in limerIQ has a distinct visual identity that makes workflow architecture immediately comprehensible:
AI Task Steps appear as blue rounded rectangles. These are the workhorses of AI execution -- where Claude, GPT, or other models perform reasoning tasks. Each task step shows the step name and a badge indicating which model handles it.
Human Interaction Points stand out in purple, making it instantly clear where workflows pause for user input. The visual distinction prevents accidentally overlooking decision points during design review. When stakeholders review a workflow, they immediately see where human judgment enters the process.
Parallel Branches use a distinctive shape that visually suggests "splitting" or "fanning out." You see at a glance where work distributes across multiple paths. This is crucial for understanding workflows that use competitive execution or parallel development patterns.
Integration Points use a complementary shape that visually suggests "converging" or "merging." Together with parallel branches, this creates a clear visual sandwich pattern: branch out, work in parallel, converge back together.
Code Steps appear in green, distinguishing deterministic code execution from AI-driven reasoning. When reviewing workflows, you immediately know which steps involve AI judgment versus pure computational logic.
Validation Checkpoints use stop-sign-inspired shapes in red, signaling "check before proceeding." The distinctive appearance catches attention during reviews, ensuring quality gates are not overlooked.
Connection Visualization
Transitions between steps render as animated edges with arrow markers showing direction of flow. When workflows branch based on conditions, the condition text displays along the edge, so branching logic remains visible without inspecting underlying configuration.
For complex workflows with dozens of steps, a minimap in the corner provides a zoomed-out view of the entire structure, with each step colored according to its type. You can navigate large workflows without losing context.
Editing Without Memorizing Syntax
Selecting any node opens a properties panel with fields appropriate for that step type. The panel adapts to what you are editing:
- Task steps show model selection, thinking level, persona assignments, and instruction fields
- Parallel structures show branch configuration and integration settings
- Human checkpoints show exit conditions and interaction limits
- Validation steps show threshold configuration and strictness settings
This context-sensitive editing eliminates the need to remember which options apply to which step types. The visual editor guides you to valid configurations.
Preserving Your Work
A subtle but critical feature of the visual editor is its respect for your data. Many visual editors strip information they do not understand, leading to data loss when saving. limerIQ's visual editor only modifies fields it explicitly manages, preserving any custom metadata or future schema extensions in your workflow files.
This matters because you can add custom fields for your own tooling without fear of loss, and future limerIQ versions can introduce new capabilities without breaking your existing workflows.
The Subway Map: Watching Your Workflow Execute
While the visual editor handles design time, the subway map handles execution time. When you run a workflow, the subway map appears in the dashboard, showing exactly where execution stands at every moment.
Real-Time Status at Every Step
Each node in the subway map reflects current execution status through clear visual indicators:
Pending (gray): Steps not yet reached appear grayed out, providing context for what comes next in the workflow.
Running (pulsing blue): Currently executing steps pulse with animation, drawing attention to where active work is happening.
Completed (green): Successfully finished steps turn green, creating a visual progress trail that shows how far execution has advanced.
Failed (red): Failed steps turn red immediately, making failures impossible to miss even in complex workflows.
Paused (yellow): Steps waiting for user input show yellow, indicating attention needed before the workflow can continue.
Visualizing Parallel Execution
The subway map excels at showing parallel execution. When work distributes to multiple branches, the subway map creates visual lanes -- one for each parallel path. You see at a glance which branches complete first, which are still running, and which have failed.
For iterative workflows that repeat across multiple cycles, the subway map shows each iteration as a separate lane, labeled with the iteration number. Complex multi-iteration workflows become tractable when you can see iteration three completing while iteration two still runs.
Dynamic Updates
When workflows create branches dynamically based on AI decisions, the subway map updates in real-time as branches are created. You might start with a planning step that identifies five components to build, then watch the subway map grow five new branch lanes as parallel work begins.
This dynamic visualization provides immediate feedback on how AI decisions affect workflow structure.
Practical Benefits
Better Design Reviews
Before visual tooling, workflow reviews required reading configuration files and mentally constructing the graph. Now, pull requests can include screenshots or recordings of the visual editor. Reviewers see the workflow structure immediately, focusing their attention on logic rather than syntax.
Faster Debugging
When a workflow fails at step 7 of 12, the subway map shows exactly which steps completed, which failed, and which never ran. Combined with the ability to retry steps or swap models, debugging becomes interactive rather than archaeological.
Smoother Onboarding
New team members can open any workflow and immediately understand its structure. The visual differentiation between step types means even complex workflows become readable without deep platform expertise. What would take hours to explain becomes apparent in minutes.
Executive-Friendly Monitoring
For long-running workflows, the subway map serves as a progress dashboard. Stakeholders can check execution status without understanding workflow internals. They see green progress, yellow attention-needed, and red problems -- intuitive signals that require no technical explanation.
Seeing It In Action
The companion showcase workflow demonstrates the visual editor's capabilities with a production-quality example that includes:
- Multiple step types with distinct visual appearances
- Parallel branches running simultaneously
- Iterative processing across multiple cycles
- Human checkpoints for review and approval
- Integration points where branches converge
- Conditional transitions with visible routing logic
Open this workflow in the visual editor to see how each element renders. Then execute it to watch the subway map track progress across parallel branches and iterations. The combination of design-time visibility and runtime tracking transforms how you understand and operate AI workflows.
Conclusion
Visibility transforms workflow orchestration from a configuration-and-hope exercise into a proper engineering discipline. The visual editor brings design-time clarity, making complex workflows comprehensible and reviewable. The subway map brings runtime visibility, turning execution from a black box into an observable system.
Together, these tools address the fundamental challenge of AI orchestration: understanding what your AI agents are doing, why they are doing it, and where things went wrong when they do.
The next time you build a workflow, let limerIQ show you what it is thinking.
Related Articles: